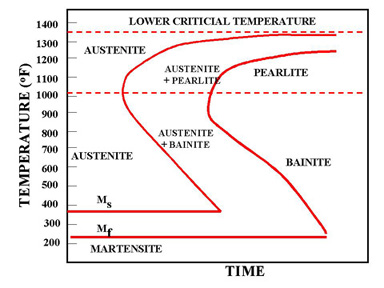
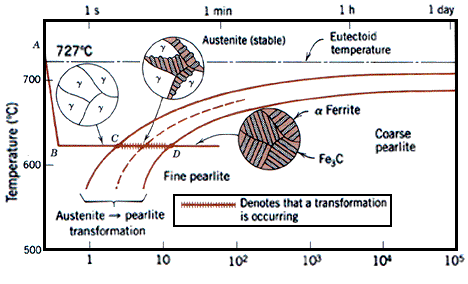
T (Time) T(Temperature) T(Transformation) diagram is a plot of temperature versus the logarithm of time for a steel alloy of definite composition. It is used to determine when transformations begin and end for an isothermal (constant temperature) heat treatment of a previously austenitized alloy. When austenite is cooled slowly to a temperature below LCT (Lower Critical Temperature), the structure that is formed is Pearlite. As the cooling rate increases, the pearlite transformation temperature gets lower.
In Figure 1a the area on the left of the transformation curve represents the austenite region. Austenite is stable at temperatures above LCT but unstable below LCT. Left curve indicates the start of a transformation and right curve represents the finish of a transformation. The area between the two curves indicates the transformation of austenite to different types of crystal structures. (Austenite to pearlite, austenite to martensite, austenite to bainite transformation.)
You might also like
| Fe-Fe3C T-T-T Diagram Fe-Fe3C T-T-T Diagram, Adapted from... | Bainite Bainite is an acicular microstructure... | Phase Diagram of Steel Fe-Fe3C Phase Diagram, Materials Science... | Phase Diagrams Fe-Mn, Fe-Co, Fe-Mo In pure iron, the A4 (1394 °C) and... |
 Alloy Suppliers
 Aluminum
 Aluminum Extrusions
 Copper-Brass-Bronze
 Nickel
 Magnets
 Stainless Steel
 Stainless Steel Tubing
 Steel Service Centers
 Titanium
 Tungsten
 Wire Rope