Fe-Fe3C Phase Diagram, Materials Science and Metallurgy, 4th ed., Pollack, Prentice-Hall
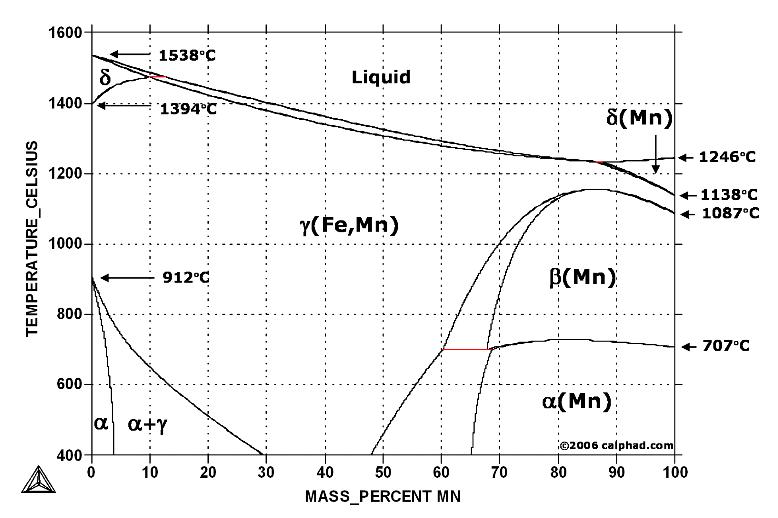
Figure above shows the equilibrium diagram for combinations of carbon in a solid solution of iron. The diagram shows iron and carbons combined to form Fe-Fe3C at the 6.67%C end of the diagram. The left side of the diagram is pure iron combined with carbon, resulting in steel alloys. Three significant regions can be made relative to the steel portion of the diagram. They are the eutectoid E, the hypoeutectoid A, and the hypereutectoid B. The right side of the pure iron line is carbon in combination with various forms of iron called alpha iron (ferrite), gamma iron (austenite), and delta iron. The black dots mark clickable sections of the diagram.
You might also like
 |
 |
 |
 |
 Alloy Suppliers
 Aluminum
 Aluminum Extrusions
 Copper-Brass-Bronze
 Nickel
 Magnets
 Stainless Steel
 Stainless Steel Tubing
 Steel Service Centers
 Titanium
 Tungsten
 Wire Rope