When considering the response of metallic materials to cyclic loading, it is essential to distinguish between components such as machined parts, which are initially free of defects, and those such as castings and welded structures, which inevitably contain pre-existing defects. The fatigue behaviour of these two types of component is quite different. In the former case, the major part of the fatigue life is spent in initiating a crack; such fatigue is ‘initiation-controlled‘. In the second type of component, cracks are already present and all of the fatigue life is spent in crack propagation, such fatigue is ‘propagation-controlled’.
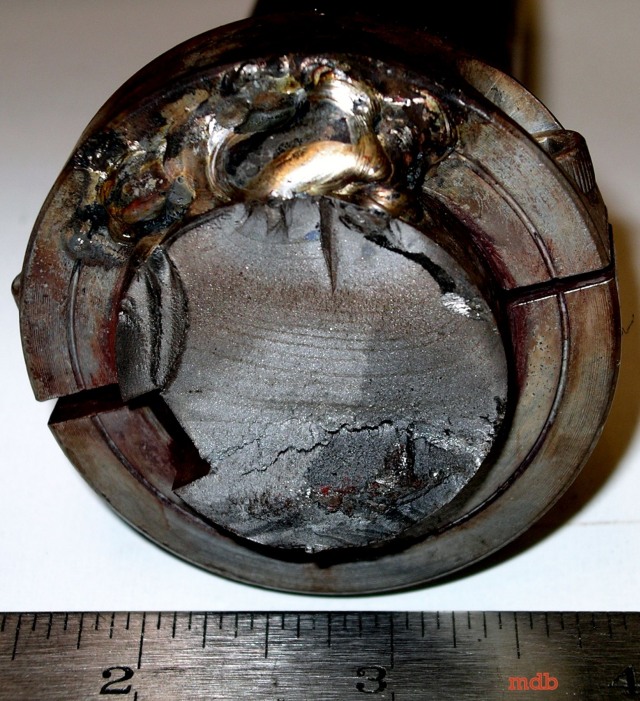
 Two way bending fatigue in a bolt. Large Arrow at 1 o’clock shows area of fatigue crack initiation.
For a given material, the fatigue strength is quite different depending on whether the application is initiation- or propagation-controlled. Also the most appropriate material solution may be quite different depending on the application. For example with initiation-controlled fatigue, the fatigue strength increases with tensile strength and hence it is usually beneficial to utilise high strength materials. On the other hand, with propagation-controlled fatigue, the fatigue resistance may actually decrease if a higher strength material is employed.
Initiation-Controlled Fatigue
The fundamental diagram in fatigue testing is the Wöhler or S-N-diagram (Figure 16). Specimens are exposed to cyclic loading with a constant amplitude and the number of cycles to fracture is recorded. This parameter is plotted against the corresponding stress amplitude with a double- or semi-logarithmic scale.
The diagram is divided into two parts. In the first part, life time increases with decreasing alternating stress amplitude. In the second part for most-ferritic steels the curve becomes horizontal and defines a ‘fatigue limit’ stress below which failure can never occur. The transition or ‘knee’ between the two parts of the curve lies between 3 and 10 x 106 cycles, depending on the material. For other alloys, e.g. fcc-metals, which do not show a fatigue limit, an ‘endurance limit’ is defined as the stress amplitude corresponding to a life of 107 cycles.
One characteristic feature of fatigue properties is the wide scatter of results under constant testing conditions. Therefore 6-10 experiments must be performed for each stress amplitude. The analysis is done by means of statistical evaluation leading to different S-N curves for various life time probabilities (10%, 50%, 90% curves).
Fatigue damage
- Crack-free stage
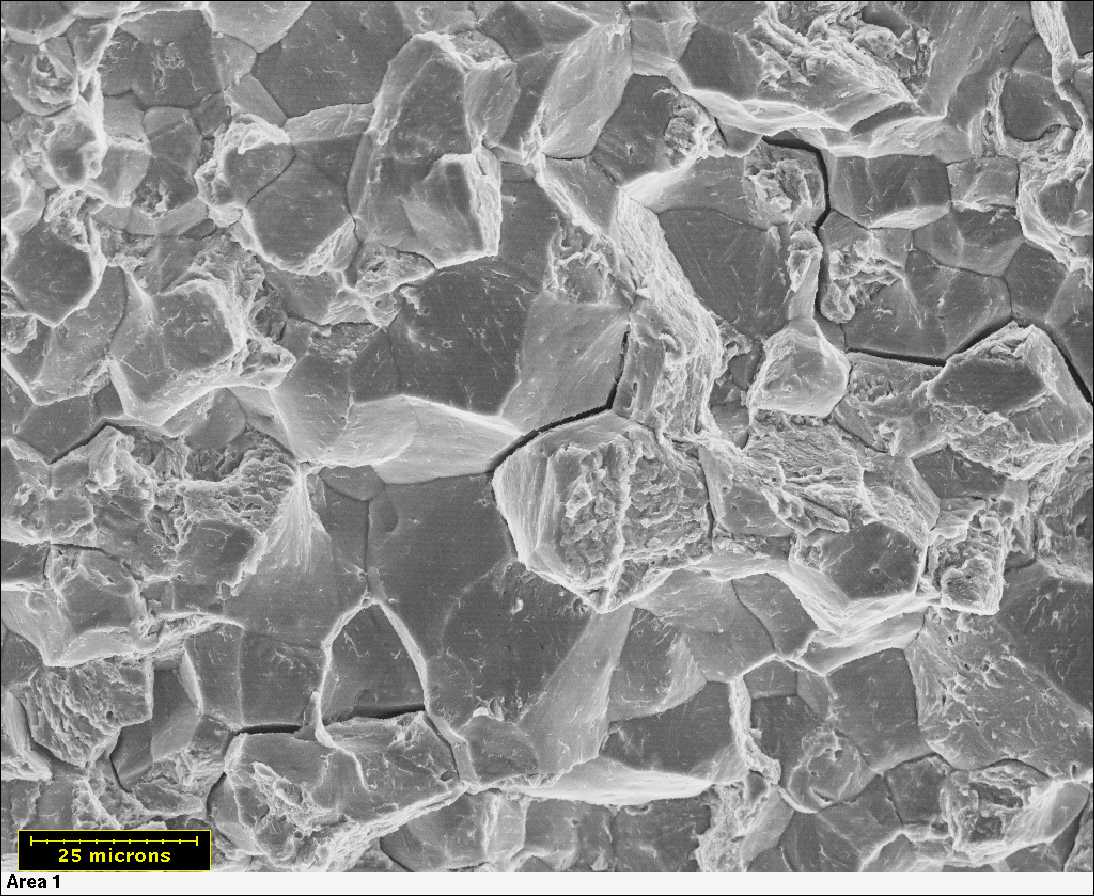
During the first 104 stress cycles, although the loading is nominally elastic, dislocation activity occurs in localised areas and leads to the formation of bands of localised plastic deformation known as “persistent slip bands” (PSB).
- Crack initiation
Crack initiation generally takes place within the persistent slip bands. In the case of pure metals, crack initiation usually occurs at the surface. In commercial quality materials, crack initiation usually occurs at non-metallic inclusions or other impurities which act as microscopic sites of strain concentration.
- Crack propagation
Once initiated the crack propagates through the first few grains in the direction of maximum shear stress, i.e. at 45° to the normal stress. When the crack has attained a length of a few grain diameters, continued propagation is controlled by the cyclic stress intensity field at the crack tip and the crack path becomes oriented at 90° to the maximum principal stress direction. Although the major part of the fatigue life is spent in crack initiation, this is not apparent from examination of the fracture surface where only the final propagation stage can be seen.
Influences of various parameters
The relationships between initiation-controlled fatigue strength and other parameters are complex and sometimes only known qualitatively. Nevertheless they are of great importance for material selection and dimensioning of structural parts. Therefore a number of different parameters are discussed below with respect to their influence on fatigue properties.
- Loading: Different loading conditions include cyclic tension and compression, cyclic torsion, cyclic bending and any possible combination of these. As discussed in the context of yielding in Section 2.3 ofLecture 2.3.1, such complex stresses can be combined by means of the Hencky-von Mises expression to generate an equivalent stress which can be compared with the fatigue strength obtained from uniaxial loading.
- Mean stress: Fatigue strength is reduced by tensile mean stress and increased by compressive mean stress.
- Frequency: For most materials no influence is observed over a wide range. Some alloys show a smaller life time for lower frequencies because corrosion effects interfere.
- Microstructure: The influence of microstructural modification on fatigue strength is similar to that on tensile strength. In general fatigue strength increases in proportion to tensile strength. For example, for a wide range of wrought steels, the fatigue strength is between 40% and 50% of the tensile strength. Improved purity raises fatigue strength.
- Residual stresses: As with mean stress effects, compressive residual stress improves fatigue strength, whereas internal tensile stress has the opposite effect. To optimise fatigue strength, surface compressive residual stress is generated by techniques such as shot peening, and surface rolling.
- Surface: Surface finish has a large influence on fatigue; the smoother the surface the better the fatigue strength. The treatment of surfaces during manufacturing often causes strain hardening and compressive residual stresses which both increase fatigue strength. The influence of notches is described under “Geometry”.
- Geometry: Notches and changes of section act as sites of stress concentration and hence have a considerable influence on fatigue properties. For large smooth notches, the stress concentration must be evaluated and incorporated in the fatigue analysis. Sharp notches behave as crack-like defects and cause the fatigue behaviour to be propagation-controlled.
- Welding: Welding inevitably generates small crack-like defects which greatly lower the fatigue strength and cause the fatigue to be propagation- controlled.
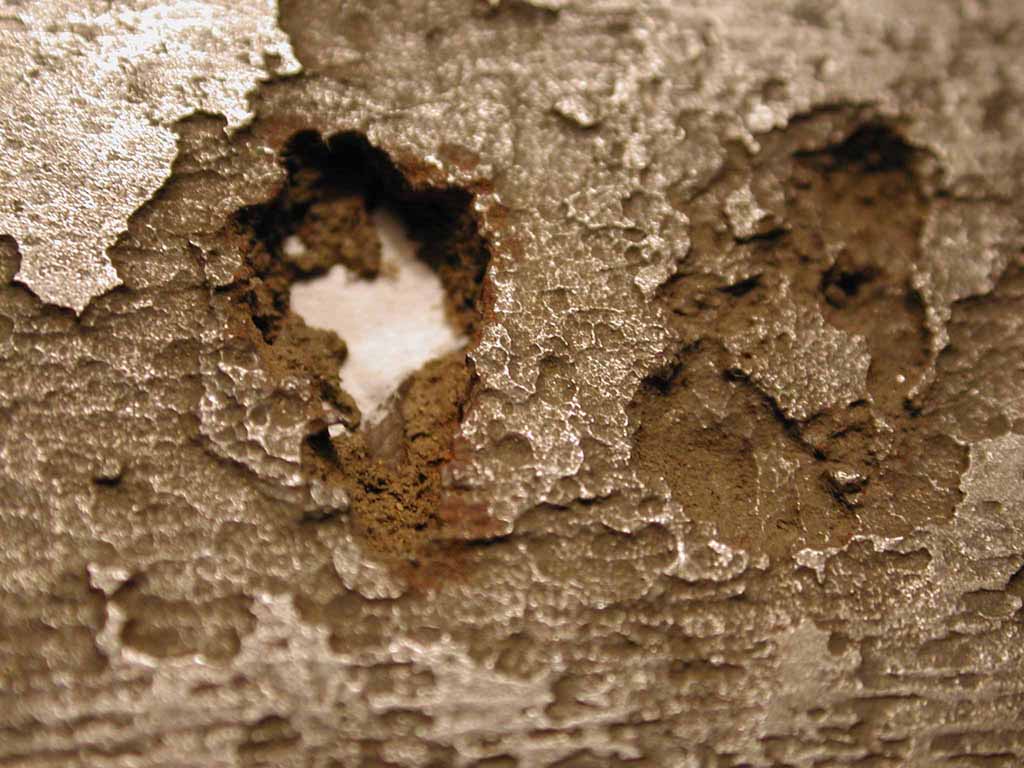
- Corrosion: Exposure to a corrosive environment facilitates both crack initiation and propagation. Consequently the fatigue strength is reduced. The fatigue limit in steels may be eliminated in a corrosive element.
Fatigue limit under actual service conditions
The S-N diagram characterises material behaviour under single-amplitude loading. For weight-saving constructions exposed to complex stresses, the parameters determined by such tests are not sufficient.
For testing under realistic conditions, an analysis of the actual stresses has to be obtained. For that purpose the sequence and duration of different stress levels, as well as their rise or fall, are recorded. This stress-time function is either reproduced under laboratory conditions, or special testing programmes are calculated from these data and used in experiments. Results obtained by this method cannot be transferred to different materials and loading conditions.
Prediction of cumulative damage
The fundamental method of life time cumulative damage prediction was formulated by Miner. The damage from each cycle at a certain stress level is defined as the reciprocal value of the number of cycles to fracture (1/Ni). Fracture occurs when the sum of cycles at each level (ni) related to the number of cycles to failure (Ni) is equal to unity. The mathematical expression is:
Since this is a very simple equation, results are widely scattered. In reality the values form a Gaussion distribution with a maximum around 1. To guarantee safe construction, calculations are made with factors smaller than 1 and stresses below their maximum values. Furthermore it is possible to take the effects of different loading levels into account with respect to their number, maximum stress and sequence.
Propagation-Controlled Fatigue
Steel castings, rough forgings and welded structures invariably contain surface imperfections which behave as minute crack-like defects which effectively eliminate the crack-initiation stage in fatigue. Consequently the whole of the fatigue life is concerned with crack propagation. The rate of crack advance is determined by the cyclic stress intensity D Kr which is the cyclic equivalent of the stress intensity factor KI defined in Section 1.5.
DKI = Y Ds
where
Ds is the cyclic stress range
a is the crack depth
Y is the correction function dependent on the crack and test piece geometry.
The rate of crack propagation is then given by the following relationship which is known as Paris’ Law:
= C DKIm
N = Number of cycles
C is a material constant which is inversely proportional to Young’s modulus E. The power m has a value of about 3 for most metallic materials.
The advantage of the fracture mechanics description of crack propagation is that the rate equation can be integrated to determine the number of cycles required for a crack to propagate from some initial length ai to same final length af. Thus for m = 3;
Nf = 2 (1/ai½ - 1/af½ ) / (CY3Ds3p3/2)
ai may be a known crack size or an NDT limit, af may be a critical defect size for unstable fracture or a component dimension such as the wall thickness of a vessel.
In the above equation for the fatigue life, the constant C is dependent on the type of material but is not sensitive to variations in microstructure or strength level. Consequently, for a given cyclic stress range,Ds, the fatigue life is independant of the strength of the material. If, however, the stress range increases in proportion to the material yield strength, then the fatigue life will be less for the higher strength material. For example, a two-fold increase in stress range produces almost a ten-fold reduction in fatigue life. This is a major constraint on the utilisation of higher strength structural steels for fatigue dominated applications.
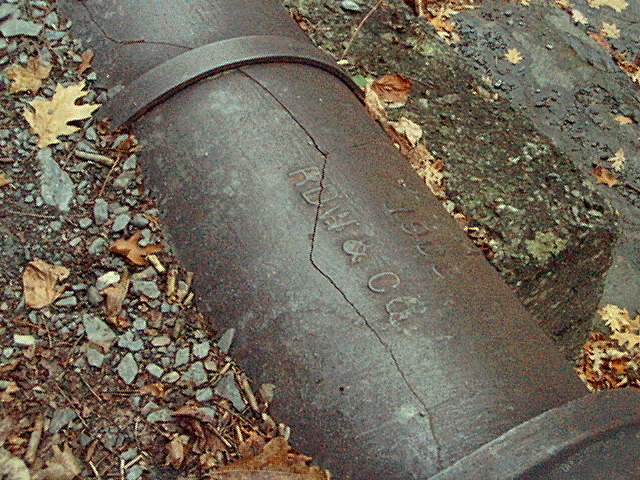
Fatigue Crack
The fatigue behaviour of welded joints is propagation-controlled. However it is impracticable to apply a fracture mechanics analysis because the initial defect size cannot be evaluated and the cyclic stress range is amplified by local stress concentration effects associated with the weld profile. Instead the fatigue strength is determined experimentally for the range of weld types and welding processes which are commonly employed in welded structures. This data is presented as a series of S-N curves for different weld classifications as shown in Figure 16.
The fatigue strength of welded joints is not sensitive to the strength of the parent plate. Consequently, as explained previously, it is difficult to take full advantage of higher strength steels in welded structures where there is significant exposure to cyclic loading.
You might also like
 |
 |
 |
 |
 Alloy Suppliers
 Aluminum
 Aluminum Extrusions
 Copper-Brass-Bronze
 Nickel
 Magnets
 Stainless Steel
 Stainless Steel Tubing
 Steel Service Centers
 Titanium
 Tungsten
 Wire Rope