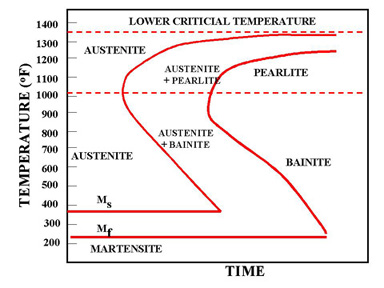
 Fe-Fe3C T-T-T Diagram, Adapted from Callister pg. 295, Fig. 10.6
The time-temperature transformation curves correspond to the start and finish of transformations which extend into the range of temperatures where austenite transforms to pearlite. Above 550 C, austenite transforms completely to pearlite. Below 550 C, both pearlite and bainite are formed and below 450 C, only bainite is formed.
You might also like
| Phase Diagram of Steel Fe-Fe3C Phase Diagram, Materials Science... |
 |
 |
 |
 Alloy Suppliers
 Aluminum
 Aluminum Extrusions
 Copper-Brass-Bronze
 Nickel
 Magnets
 Stainless Steel
 Stainless Steel Tubing
 Steel Service Centers
 Titanium
 Tungsten
 Wire Rope